 Rainy Day Math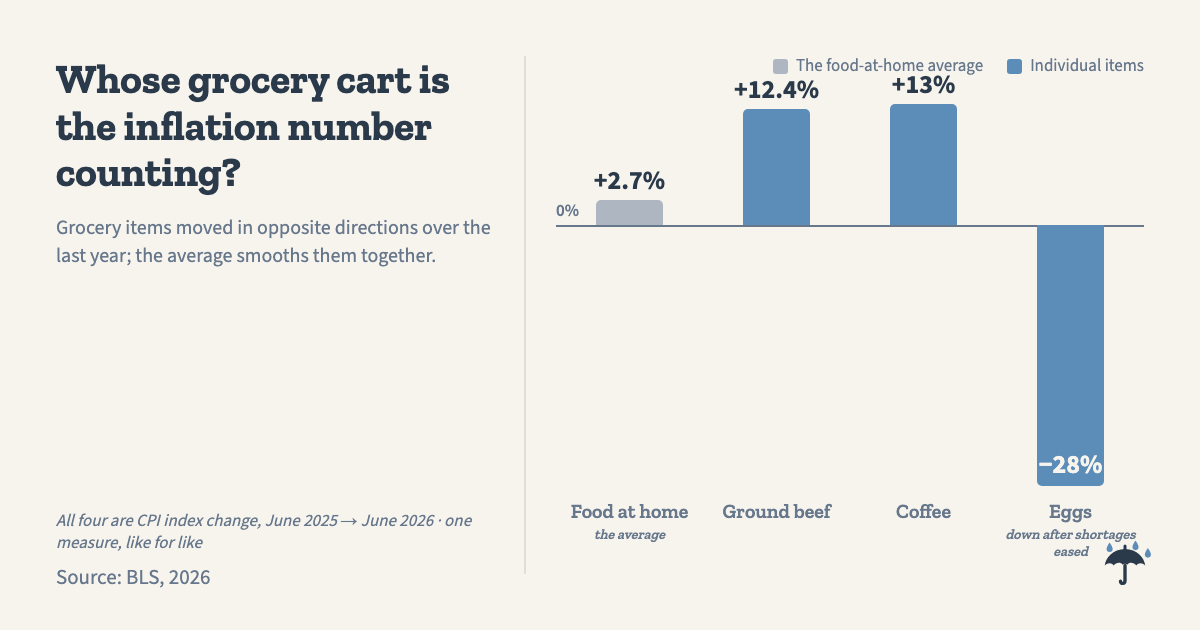
Whose grocery cart is the inflation number counting?
As of the June 2026 report, official inflation is running at 3.5 percent for the year, before seasonal adjustment. Groceries specifically: 2.7 percent. If your receipts have been telling you a different story, you are not imagining it, and you are also not catching the government in a lie. Both numbers are real. They are just measuring a cart that probably is not yours.
This piece is about how that number gets built, because once you see the machinery, the gap between the headline and your receipt stops being mysterious.
A survey, not a feeling
The Consumer Price Index comes from the Bureau of Labor Statistics, which sends price collectors to record what stores actually charge, month after month, across the country, for the same specific items, by store visit and phone and web. It records what the shelf charges rather than what companies announce. That part of the operation is about as honest as government statistics get, and it is why the same index can report, in the same June release, that coffee is up 12.9 percent, ground beef is up 12.4 percent, and eggs are down 27.9 percent from a year ago.
It is also thinner than it used to be. In June the BLS collected about 55,000 of the 84,000 store prices it set out for, a 65 percent collection rate against 79 percent in 2019, and estimated the rest from similar items. Since 2025 it has stopped collecting in Lincoln, Provo, and Buffalo entirely, along with roughly 15 percent of the sample everywhere else. The agency’s own testing puts the effect on the headline at less than a hundredth of a percentage point. The index is not smoothing your grocery run into one flattering number. It tracks each item and then rolls them up.
The rolling-up is where your mileage varies. Every item gets a weight based on what the average urban household spends on it, and your household is not average. Nobody’s is. The index is an average of everyone’s cart, and an average is a real thing that no individual person experiences.
the share of the inflation index that is shelter, not groceries. Most of it is an estimated rent that no homeowner actually pays.
Source: BLS CPI, June 2026
The biggest item in the basket is nobody’s receipt
About 35 percent of the index, the largest slice by far, is shelter. And the way homeowners’ housing costs get counted is the strangest piece of machinery in the whole index, worth knowing about because so much of the headline number rides on it.
Renters are easy: the rent is a price, it goes in. Homeowners are the puzzle. A house is partly a purchase and partly an investment, and the index does not track investments. So the BLS counts something called owners’ equivalent rent: an estimate of what a homeowner’s house would rent for. That estimate sets the size of the slice, and the month-to-month movement comes from the rents that actual renters nearby are actually paying. It is a defensible answer to a genuinely hard question. It is also a price that not one person in the country actually pays. When shelter is a third of the index and the biggest chunk of shelter is an estimate, “official inflation” and “what I paid this month” were never going to be the same number.
The egg trap, or: which number are you quoting?
One more piece of machinery, and it is the one that trips up news segments constantly. The BLS publishes two different egg numbers, and in June 2026 they disagreed by a lot:
| Measure | Eggs, year over year |
|---|---|
| CPI index (all eggs, weighted, quality-adjusted) | down 27.9% |
| Average price (grade A large, by the dozen only) | down 43.3%, to $2.14 |
Neither is fabricated, but they are built for different jobs. The average price is the narrow one: a dozen large Grade A eggs and nothing else, since the BLS leaves cartons of six and eighteen out of it. The index is the broad one, covering every kind of egg in the sample, and it measures the change in price rather than the price itself. The BLS publishes the two prices, $2.14 this June against $3.78 last June, and says plainly that its average prices are meant to show what things cost in a month rather than how much they have moved. The 43.3 percent is our subtraction, not their statistic. The trouble starts when someone quotes the sticker measure for one product and the index measure for another in the same breath, which makes honest numbers look like a cover-up or a crisis, depending on which way you splice them. When we chart these, we pick one measure and stay in it. It is a small discipline, and most people talking about inflation on television do not bother with it.
What we can’t tell you
What a person can do is check the machine. The BLS posts the full release between the 10th and the 14th of the following month at bls.gov/cpi, item by item, with the sticker-price series on the same data pages. Most months, anyway: there is no October 2025 report, because the shutdown stopped collection that month and the prices were never recovered. Pull up the two or three items your month actually turns on and see what they say. Sometimes they will match your receipts closely. Sometimes they will not, and now you know the several places in the machinery where the difference gets in.
Sources: U.S. Bureau of Labor Statistics, Consumer Price Index for June 2026, released July 14, 2026 (all items +3.5% before seasonal adjustment, food at home +2.7%, coffee index +12.9%, uncooked ground beef index +12.4%, eggs index −27.9%, all over 12 months); BLS Average Price Data, series APU0000708111, eggs grade A large per dozen, $2.141 in June 2026 against $3.775 in June 2025 (the −43.3% is our calculation from those two published prices). Shelter is 35.1% of the index per the June 2026 release and 35.6% per the annual relative-importance table dated December 2025. Collection rates from the BLS CPI response-rate tables, June 2026.