 Rainy Day Math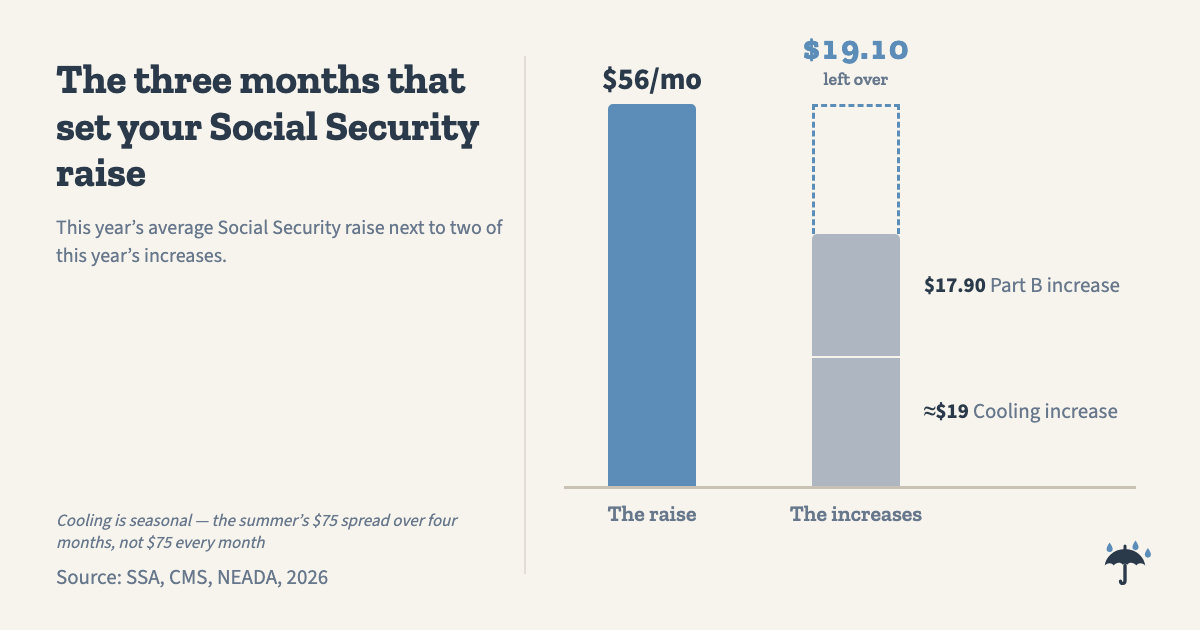
The three months that set your Social Security raise
The 2026 Social Security raise is 2.8 percent. On the average retired worker’s check, that means $2,015 a month became $2,071, a difference of $56. Those numbers come straight off the Social Security Administration’s own fact sheet, and the strange thing about them is that nobody chose them. Congress did not pick the number, and neither did the President or anyone at the SSA. The raise falls out of a formula. Automatic raises started in 1975, and the exact three-month arithmetic below has been the law since 1983.
The official name is the cost-of-living adjustment, or COLA, and the whole calculation rests on three months of the year, not twelve.
the average monthly raise. $17.90 of it goes straight back out to Medicare Part B.
Source: SSA and CMS, 2026
The actual arithmetic
The government’s Bureau of Labor Statistics keeps a running index of what things cost: rent, groceries, gas, doctor visits, the ordinary contents of a month. The particular version Social Security uses is called the CPI-W, and the W matters, but hold that thought.
The formula works like this:
- Average the CPI-W for July, August, and September of this year.
- Average the CPI-W for July, August, and September of the last year that actually produced a raise. Usually that is last year. Not always, and the exception matters below.
- The percentage change between those two averages, rounded to the nearest tenth of a percent, is next year’s raise.
That is the entire machine. The September number is published in mid-October, which is why the announcement always lands in October and never sooner. In 2025 the shutdown pushed that release to October 24, and the announcement moved along with it. The raise takes effect with the December benefit, which arrives in the January check.
So when the SSA announced 2.8 percent, what it was really saying is that the summer 2025 price level was 2.8 percent above the summer 2024 price level, as measured by that one index. Anyone with the two averages and a calculator gets the same answer. The unrounded figure was 2.7649 percent, and the law rounds it to the nearest tenth. The BLS publishes every number involved, monthly, for free. One gap is recent enough to name here: there is no October 2025 CPI at all. The shutdown stopped the price collectors that month, and the BLS says those prices cannot be gone back for.
A year when prices barely move produces a raise near zero, and the formula has actually landed there three times: 2010, 2011, and 2016. In 2010 and 2016 prices had fallen across the measuring window. 2011 is the one that shows what step 2 is doing. Prices did rise from summer 2009 to summer 2010, by about 1.5 percent, but they were still below the summer 2008 level the formula was measuring from, so the answer came out zero anyway. If you look these up on the SSA’s actuarial table, it labels them by the December they took effect rather than the January the checks landed, so the same three years appear there as 2009, 2010, and 2015. The law does not allow a negative adjustment, so the raise never goes below zero, but a 0.0 percent year is a normal output of the machine.
About that W
The CPI-W tracks the spending of urban wage earners and clerical workers, which works out to about 30 percent of the country. The BLS builds it by leaving out salaried professionals, the self-employed, and any household with nobody in the labor force, retirees included. Which is a curious index to build a retiree’s raise on, since the people receiving the raise mostly do not work anymore, and retired households spend differently: less on commuting, more on health care. Health care has a long habit of climbing faster than the rest of the index.
The BLS also publishes a research index it calls the R-CPI-E, built around the spending of Americans 62 and older, and over the years it has often run somewhat higher than the CPI-W. Higher in 34 of the last 43 years, by roughly a fifth of a percentage point a year. It has never been the legal benchmark. Whether it should be is an argument for Congress, and this page does not do arguments. What the page can tell you is which index your raise is tied to, and it is the one built from working households’ carts.
What the $56 runs into
For most retirees, the Medicare Part B premium comes straight out of the Social Security check before it ever reaches the bank. In 2026 the standard Part B premium rose from $185.00 to $202.90, an increase of $17.90 a month.
Set those side by side. The raise added $56. The premium took back $17.90. For a retiree at that average benefit paying the standard premium, the January increase that actually landed was closer to $38.
Below the average it is less, because the raise scales with the size of your check and the $17.90 does not. On a $1,200 benefit, 2.8 percent comes to $33.60, and $15.70 of it survives the premium.
We can’t tell you exactly how many people that $38 describes. Premiums vary with income, about 8 percent of Part B enrollees pay more than the standard, and some retirees don’t have a premium coming out of the check at all. The SSA’s fact sheet does not break any of it down, and we won’t pretend it does. What can be said is that the advertised raise is measured before Medicare gets its share. The two numbers come from different agencies three weeks apart: the SSA announced the raise on October 24, the CMS announced the premium on November 14, and nobody announces the subtraction.
The next announcement comes this October, built from this July, August, and September. When the September CPI-W posts, the raise is two averages and a division. You could beat the press release by an afternoon.
Sources: Social Security Administration, 2026 COLA fact sheet, announced October 24, 2025 ($2,015 to $2,071, 2.8%; the $2,071 is the SSA’s estimated average for all retired workers in January 2026); Centers for Medicare & Medicaid Services, 2026 Medicare Parts A & B premiums fact sheet, November 14, 2025 ($185.00 to $202.90, an increase of $17.90); U.S. Bureau of Labor Statistics, CPI-W, and the BLS research index R-CPI-E. The COLA formula is set in the Social Security Act.